Blog Series: TransAction At-a-Glance (Post #5) Mobility Performance and Needs

May 2, 2022

Now that this blog series has set the foundation for the TransAction Update, we are presenting elements of a needs assessment of Northern Virginia’s multimodal transportation system, starting with a focus on regional mobility. The needs assessment looks at the performance of the transportation system through 2045, detailing emerging mobility needs and preferences and the opportunities created from these changing values, services, and technologies. This analysis compares the performance of the 2017 transportation network with the Transportation Planning Board’s 2045 Constrained Long Range Plan (CLRP) transportation network. The CLRP is the region’s planned future transportation network, and while it does not include the full set of TransAction investments, it represents a useful future baseline to assess changes from today’s transportation system.
Vehicle miles traveled (VMT) is used to explain how much people drive in the region, which includes those just passing though NoVA, and commercial vehicles such as trucks. The total average daily VMT is expected to increase 27 percent from 2017 to 2045 within Northern Virginia. VMT growth is occurring at different rates in each area, with the highest percentage growth in Loudoun and Prince William Counties. This VMT growth is happening at the same time as the population of the region is expected to grow by 23 percent, as discussed in a previous post.

Average Weekday Vehicle Miles Traveled (VMT) (2017 – 2045), in Millions

2017 2045 % Growth
NoVATotal 51.6 65.5 27%
Arlington 4.1 4.7 13%
Alexandria 1.9 2.2 19%
Fairfax 28.0 34.4 13%
Loudoun 7.3 10.1 39%
Prince William 10.3 14.2 38%
Source: TPD Regional Model
COVID-19 Impact: Average weekday VMT in Northern Virginia totaled 52.78 million in 2019. Due to the travel impacts from the COVID-19 pandemic, average weekday VMT in Northern Virginia decreased to 40.35 million VMT in 2020 (a 24 percent decrease). Source: VDOT Traffic Data
VMT per household, unlike total VMT, is expected to decrease by 2045. Across the region there is a forecasted decrease from 58 miles per household per day in 2017 to 55 miles per day in 2045. This is an indication of shorter trip lengths, fewer vehicle trips, and more use of alternative transportation modes.

Average Weekday VMT per Household (2017 – 2045)

2017 2045
NoVA Total 58 55
Arlington 38 33
Alexandria 29 23
Fairfax 67 63
Loudoun 56 59
Prince William 61 63
Source: TPD Regional Model; MWCOG Cooperative Land Use Forecasts
Decreases in VMT per household will be larger in Arlington and Alexandria, where non-driving options are easier to access. Loudoun and Prince William Counties are anticipated to see increases in VMT per household, as their populations continue to grow in lower density areas with limited access to high quality transit options.

NVTA designated 11 multimodal corridors for TransAction, shown in the map below, which are currently heavily traveled and/ or anticipated to have high travel growth. While these corridors make up about 5% of the region’s roadway mileage, they carry about 56% of regional VMT. They also include Primary Highway Freight System routes, which carry 61% of regional freight VMT.
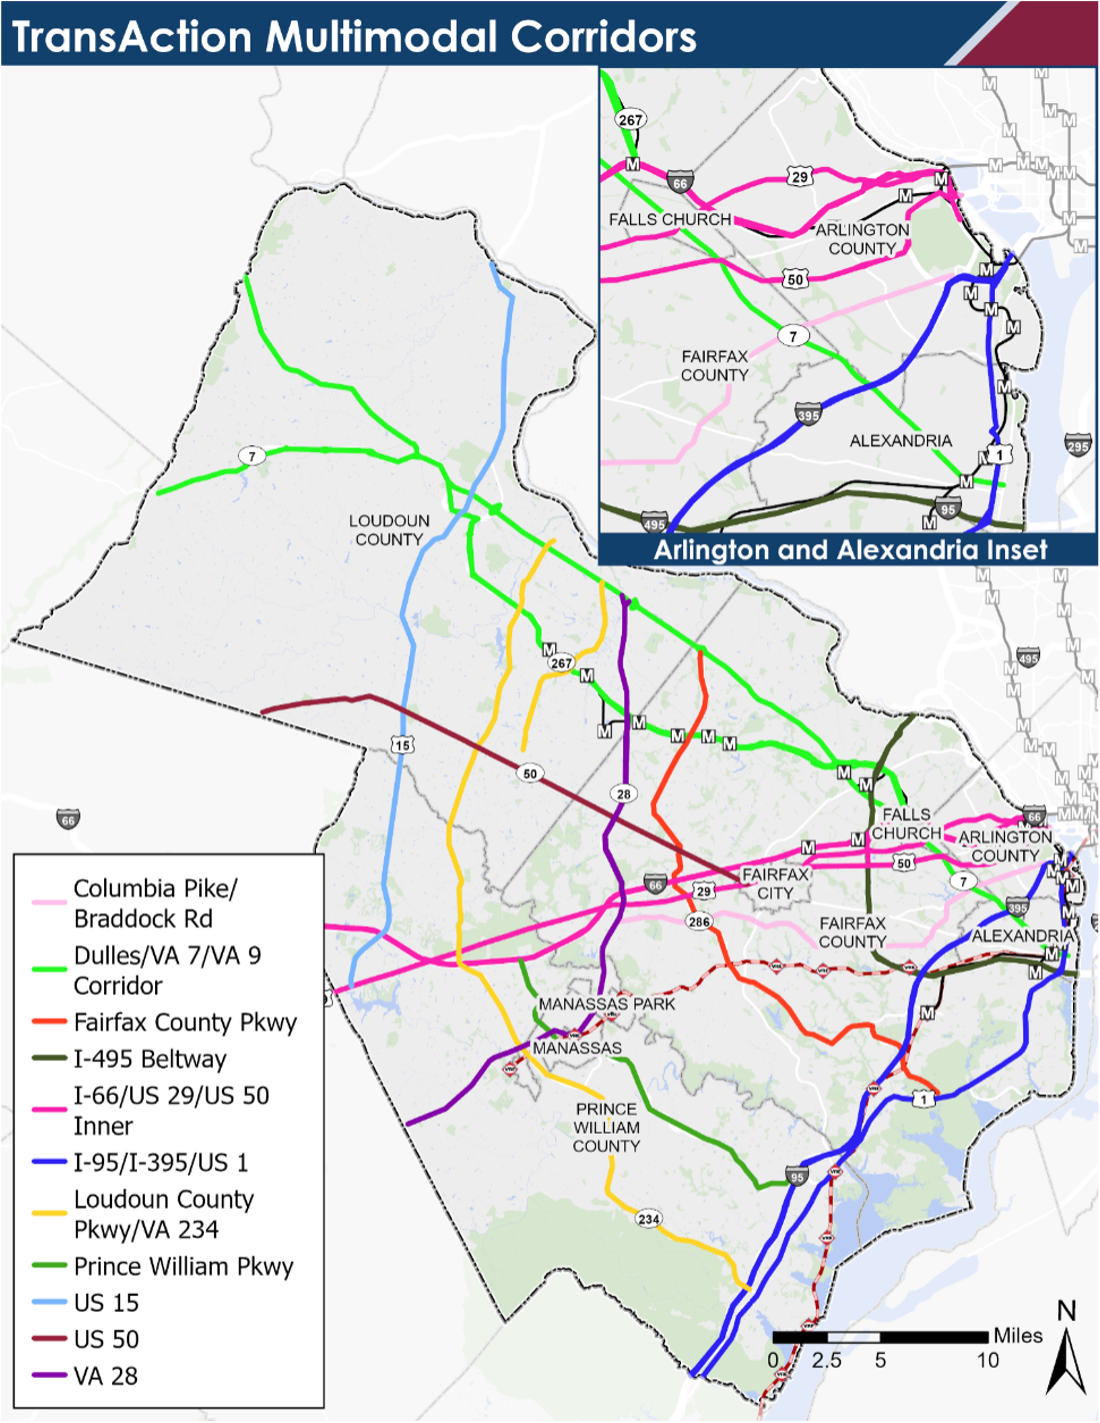
Note: TransAction corridors are multimodal (ex. train stations, bus facilities, etc.), and include all transportation facilities within broad corridors centered on the highlighted roads.
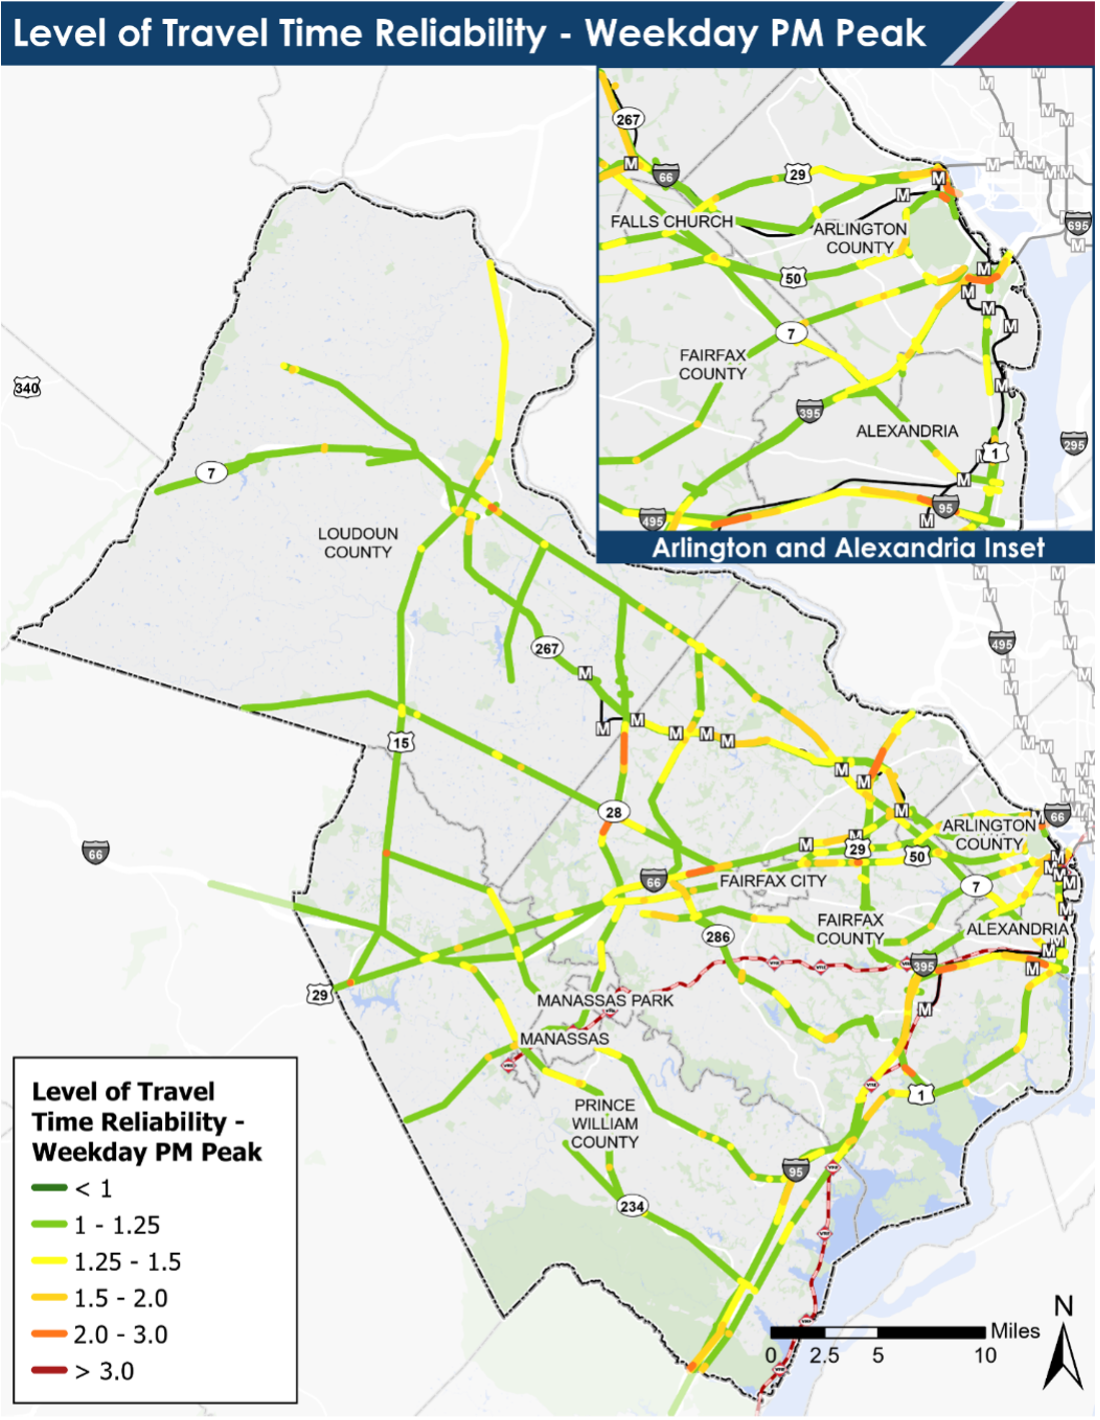
The map below shows how reliable roads were in the region in 2019 during the PM peak period, with orange or red considered unreliable. Conditions are considered unreliable when at least 20 percent of the time the trip takes 50 percent longer than the average trip on that corridor during the peak period. Overall, TransAction corridors operated with acceptable reliability during the PM peak in 2019, which is reflected as yellow or green. However, several segments along these corridors were unreliable, shown as orange or red on the map to the right. These include I-495 north of Tysons, I-66 west of Fair Oaks, VA 28 near Dulles Airport, and I-495 in Alexandria.
Level of Travel Time Reliability
The increase in total vehicle travel expected from 2017 through 2045 impacts congestion, as shown in the map below. Delay is measured as time people spend traveling at less than free-flow speeds. Between 2017 and 2045, person-hours of delay in the peak periods are forecasted to approximately double (or more) on four corridors:

  • VA 267/VA 7/VA 9,
  • I-95/I-395/US 1,
  • I-495, and
  • Loudoun County, VA 234

Most other corridors increase by more than 50 percent, except I-66 (32%) and Columbia Pike/Braddock Road (38%).

Segments of corridors with minimal increases (or even decreases) in delays, including I-66 from Haymarket to I-495, Fairfax County Parkway south of I-66, VA 28 north of I-66, and I-495 north of Tysons. These outcomes indicate the benefits of upcoming projects, particularly the expansion of managed lanes and transit in the I-66 corridor.

Public transit is also expected to see growth in ridership through 2045. In 2017, there were nearly 1.3 million daily transit boardings in the Washington metropolitan region, which is expected to increase to more than 1.63 million by 2045. Within Northern Virginia, total weekday boardings in 2017 were 293,000 riders across Metrorail, Metrobus, Virginia Railway Express (VRE), and local transit providers. Total daily ridership is projected to increase by 57 percent through 2045, totaling nearly 460,000 daily transit boardings. These projections and growth in ridership are shown in the figure below.

Average Weekday Transit Ridership (2017 – 2045)
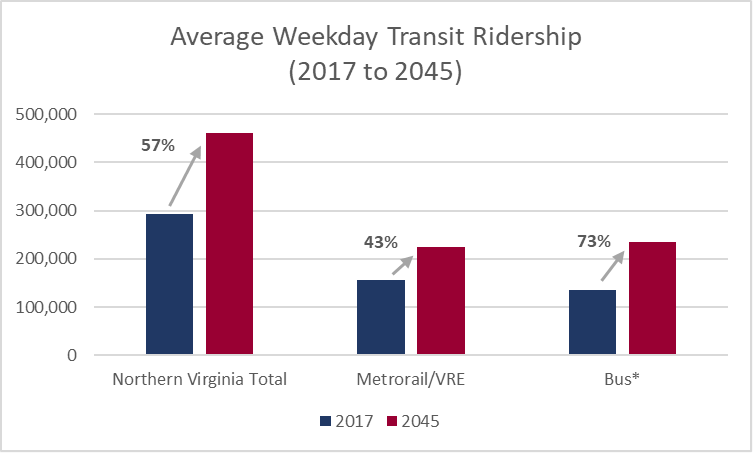
Note: Bus includes Metrobus, Fairfax Connector, OmniRide, Loudoun County Transit, DASH, ART, and CUE.
COVID-19 Impact: Transit boardings across Metrorail, VRE, and bus service in Northern Virginia dropped by 69 percent from FY2019 to FY2021. Rail ridership in Virginia decreased by 80 percent, while total bus ridership in Virginia decreased by 58 percent.

Source: Northern Virginia Transportation Commission (NVTC) FY 2021 4th Quarter (April to June 2021) Ridership and Parking Report

There has been a continued shift to transportation modes other than driving in the region over the last decade. Regional surveys conducted both before and during the COVID-19 pandemic highlight that this shift is seen more in residents who are able to telework and easily access transit. Low-income workers, workers in industries not able to telework, and residents living in areas where access to non-driving modes is limited, typically drive alone to work, often because they have no other reasonable option.

Potential Mobility Needs and Strategies

Given the mobility performance trends presented above, including challenges presented by the continued growth in VMT, congestion and delay, as well as growing demand for transit and alternative modes, a number of transportation needs and strategies were identified in the assessment:

  • More frequent and extended transit service in existing high-demand areas as well as current areas lacking service, particularly communities in equity emphasis areas;
  • Address existing gaps on the regional trails system and first/last mile connections for transit riders, bicyclists, and pedestrians to activity centers and transit stations.
  • Traffic management and strategic expansion to address bottlenecks and optimize capacity of high-volume travel corridors, particularly those facilitating inter-regional and cross-regional trips;
  • Operational enhancements and capacity expansion on minor arterials and collector roads throughout Loudoun and Prince William counties to accommodate safe and efficient travel, plus expanded travel choices, including transit service and regional trails;
  • More direct and safer connections between regional freight routes and key freight industries, distribution centers, and intermodal facilities, such as Dulles Airport; and
  • Traffic management and communication systems to manage delays resulting from unpredictable events, ranging from minor crashes and breakdowns to crashes resulting in extended lane closures or the impact of severe weather events.

Coming up in this blog series, we’ll continue to explore the performance and needs in the region’s transportation system between now and 2045 through the lenses of accessibility, safety and resiliency.

Newsletter Sign Up

To sign up for the NVTA Update newsletter and stay informed about the latest activities, project updates and initiatives at NVTA, please enter your information below and click “sign up” to register.