Building on an understanding of population and job growth trends in the region and summarized in a previous article in this TransAction At-a-Glance blog series, we now highlight how people and goods move through and around Northern Virginia today and in the months and years ahead.
Total Daily Travel
Future travel forecasts for 2045 have been compared against existing 2017 conditions. Total weekday person trips that start or end in the region are expected to increase by 28 percent between 2017 and 2045. In the table below, three components of travel are summarized: 1) commuting trips to work; 2) non-commute trips to activities such as school, shopping, medical appointments, and entertainment; and 3) commercial vehicle trips moving goods thoughout the region. Work trips are forecast to increase 31 percent over 2017 commuting levels, showing growth from pre-COVID commuting due to population and employment growth. An assessment of a sustained working from home environment through 2045 will be included in the TransAction Update Report. Non-work trips are forecast to increase by 27 percent, reflecting a growing population. Commercial vehicle trips are forecast to increase by 38 percent, consistent with past trends showing consumer demand outpacing personal travel demand.
Total Regional Weekday Person Trips

Source: TBP Regional Model
Commute Trip Patterns
In 2017 and forecasted for 2045, commute to work trips represent approximately 18 percent of daily person trips in Northern Virginia. Despite being less than one in five trips made in the region, commute trips have traditionally been a critical element in transportation planning because these trips tend to be longer (an average of 14.1 miles compared with 6.7 miles for non-work trips, one way), occur regularly on weekdays, and have the greatest share of trips made on public transportation and in carpools.
Existing Commute Patterns – Trips Starting in Northern Virginia
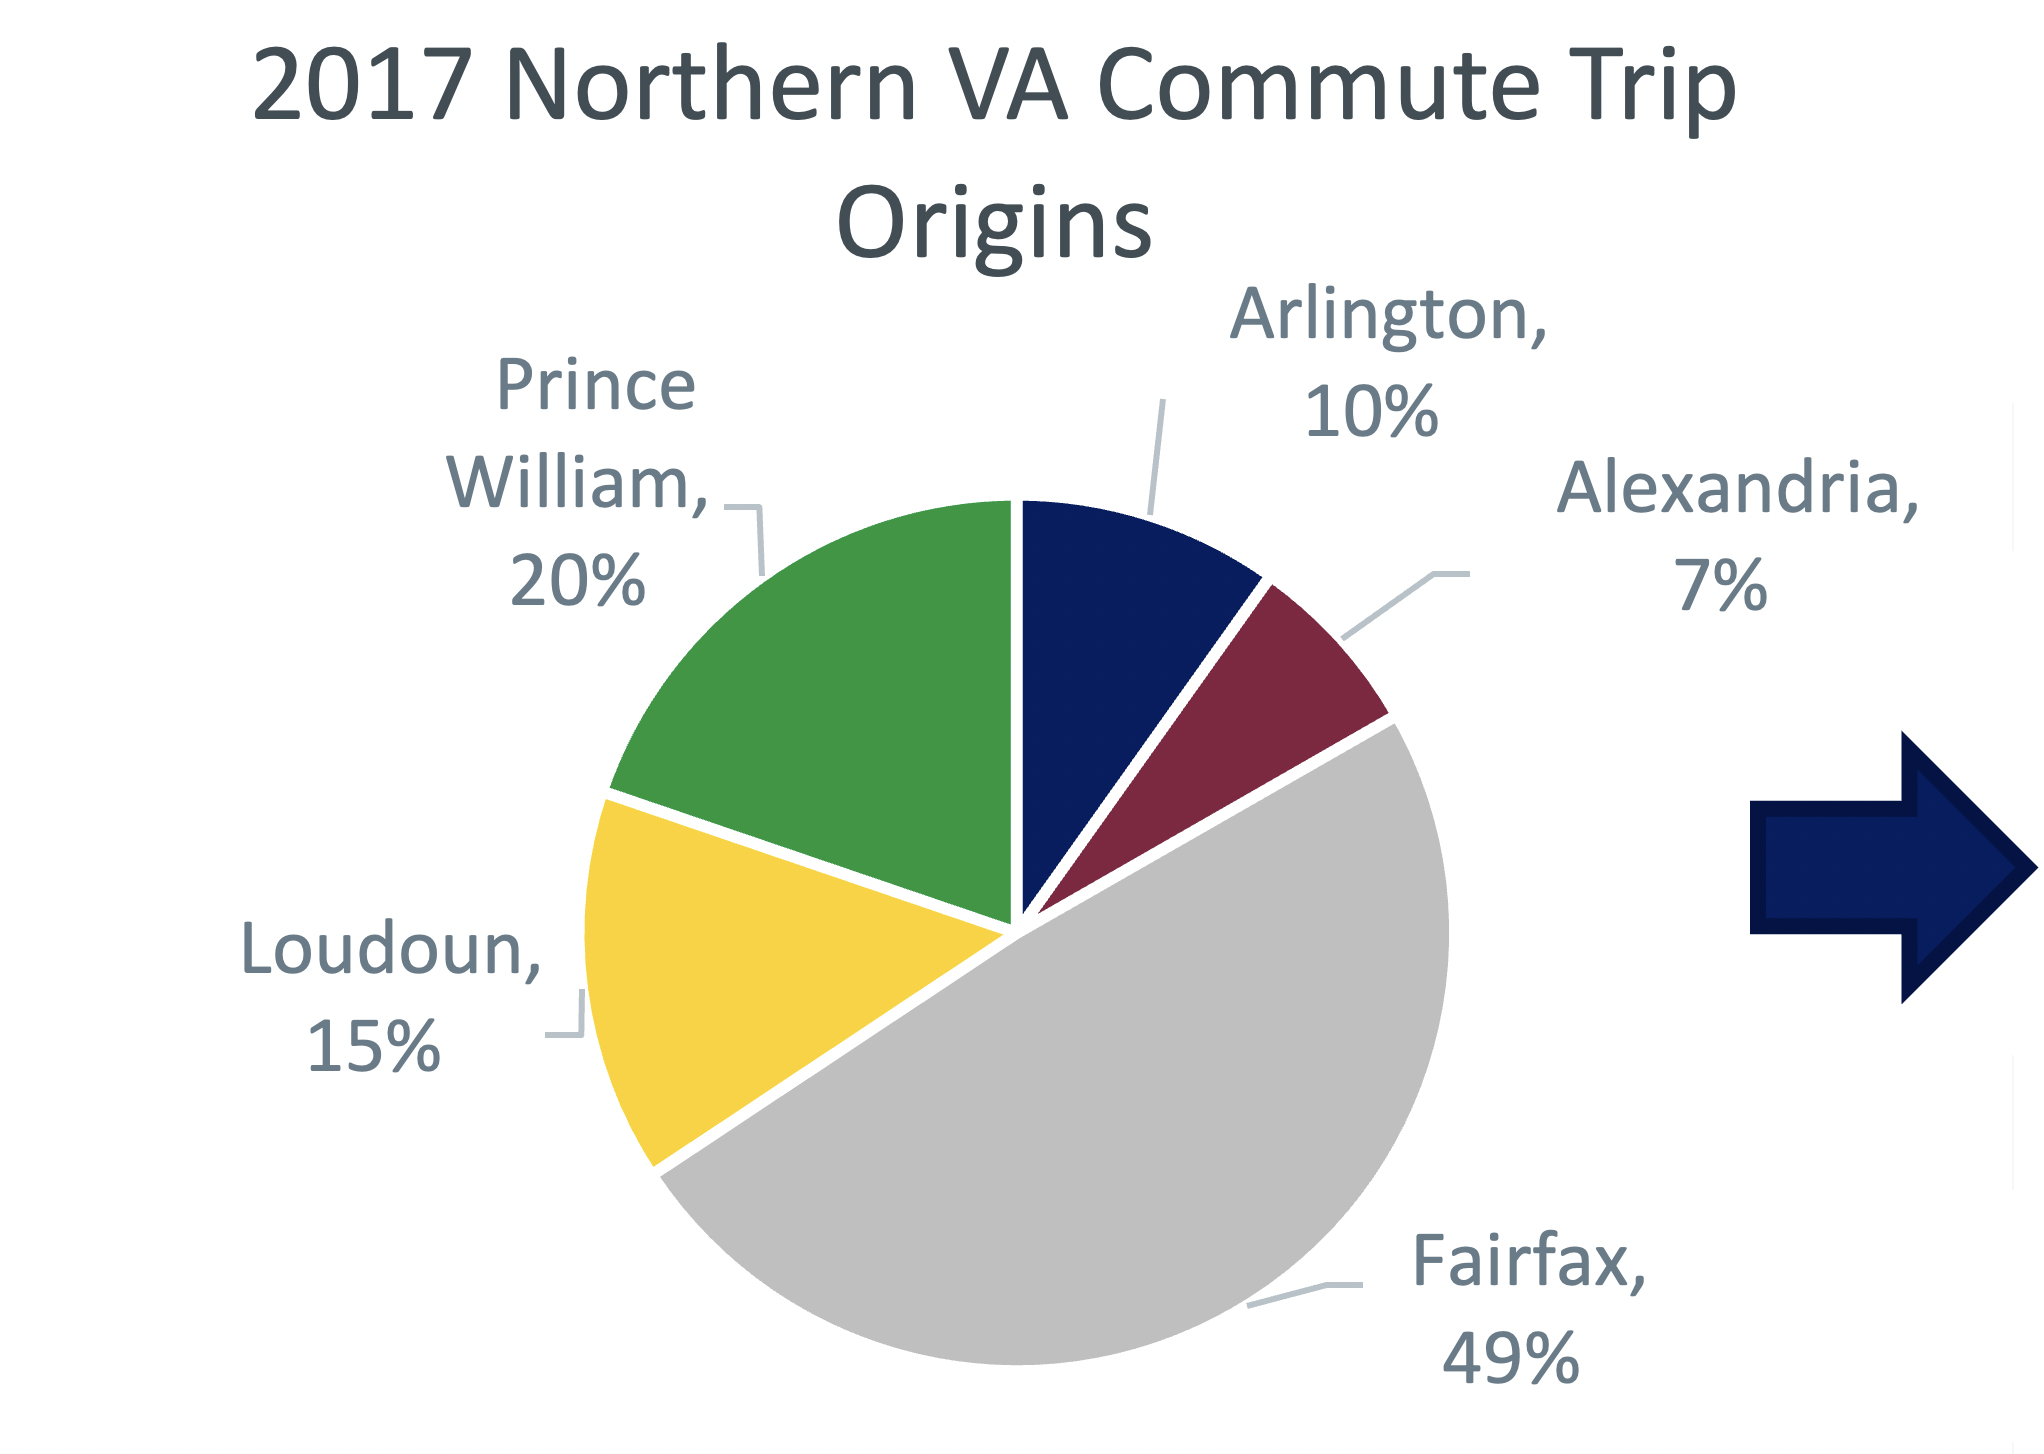
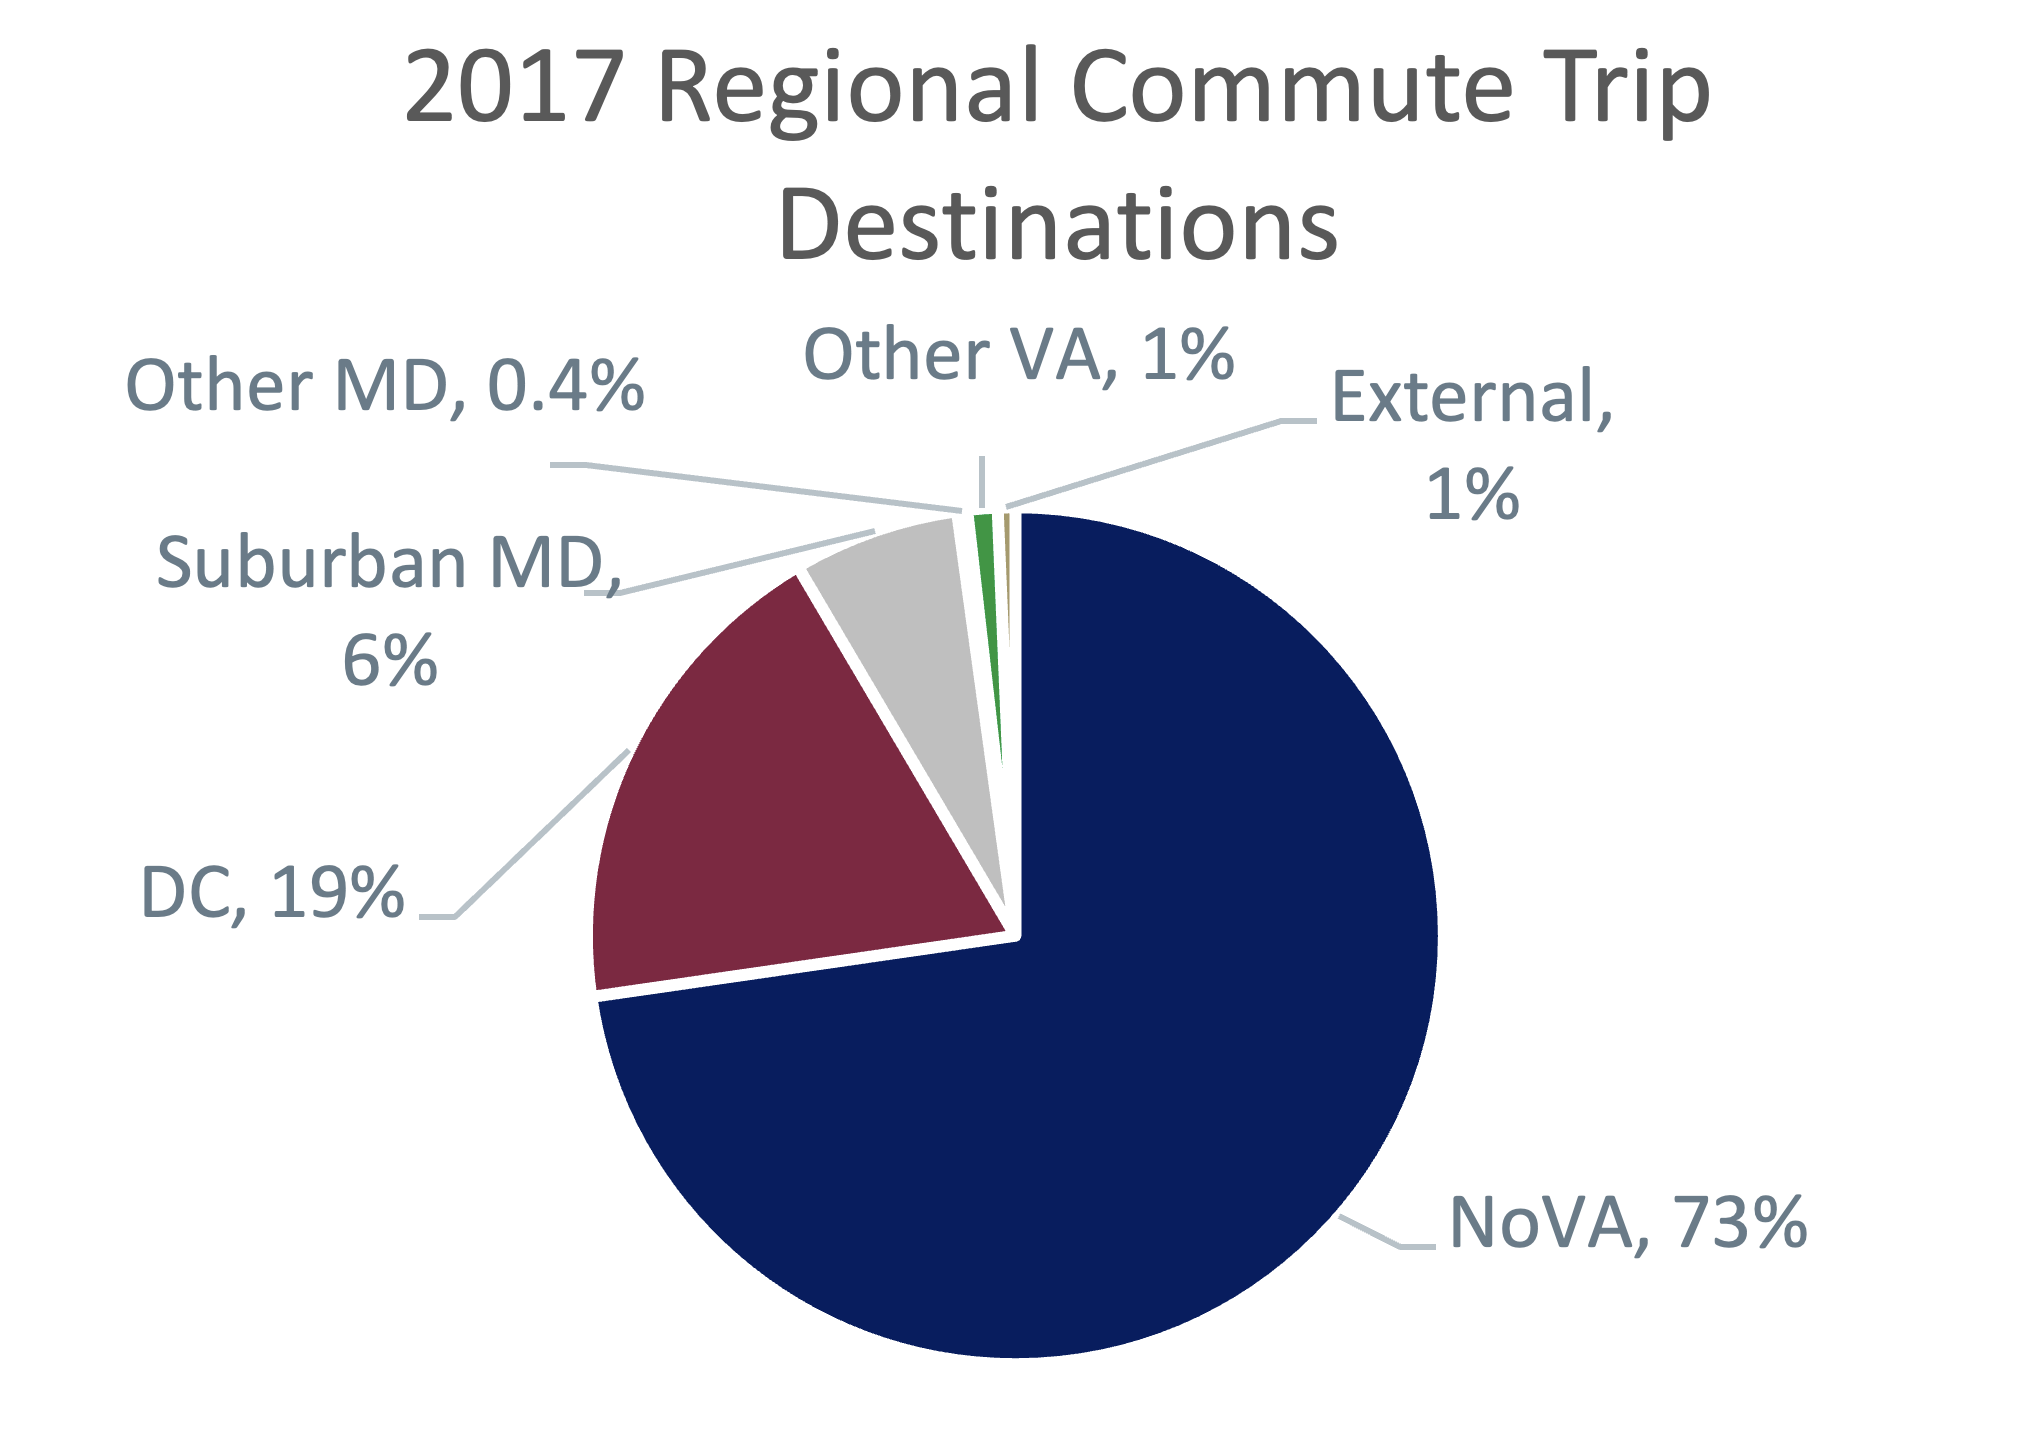
The pie charts below show the 2017 commute patterns for trips starting in Northern Virginia. The chart on the left shows that about half of commuting trips in Northern Virginia originate in Fairfax County (49 percent), followed by Prince William (20 percent) and Loudoun (15 percent) counties. 73 percent of those trips stayed within Northern Virginia, with 19 percent ending in Washington, D.C.


Existing Commute Patterns – Trips Ending in Northern Virginia
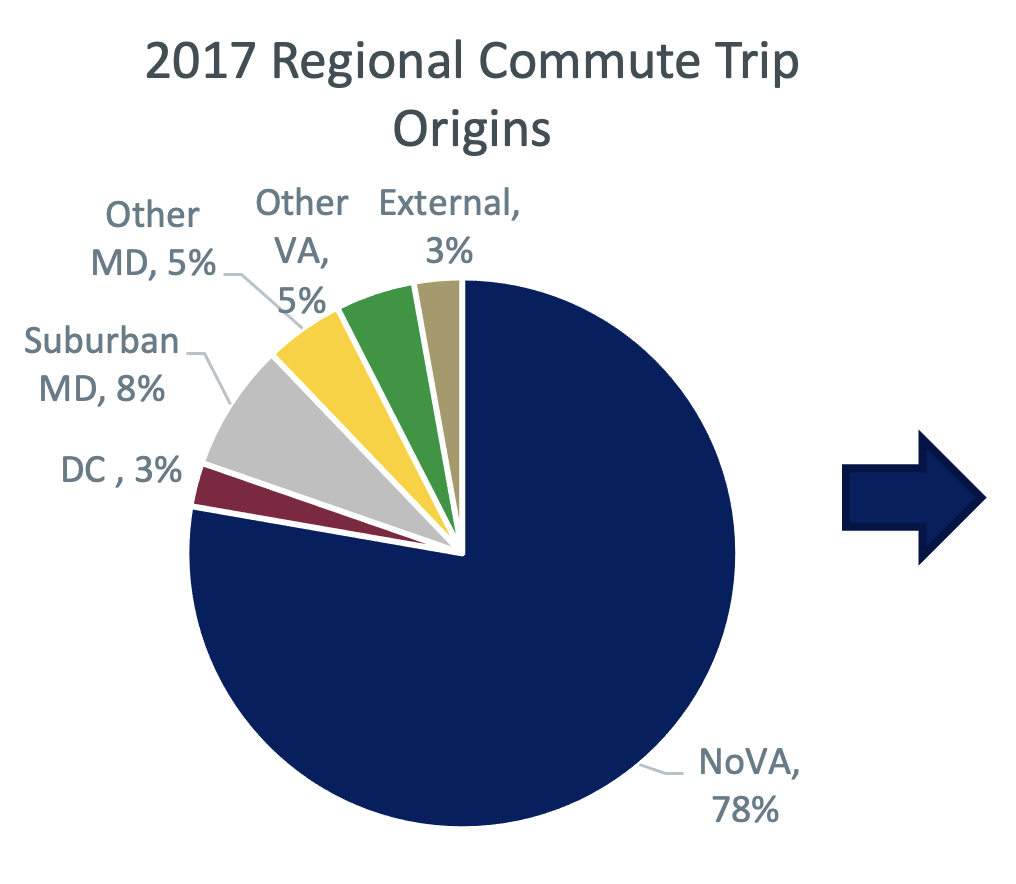
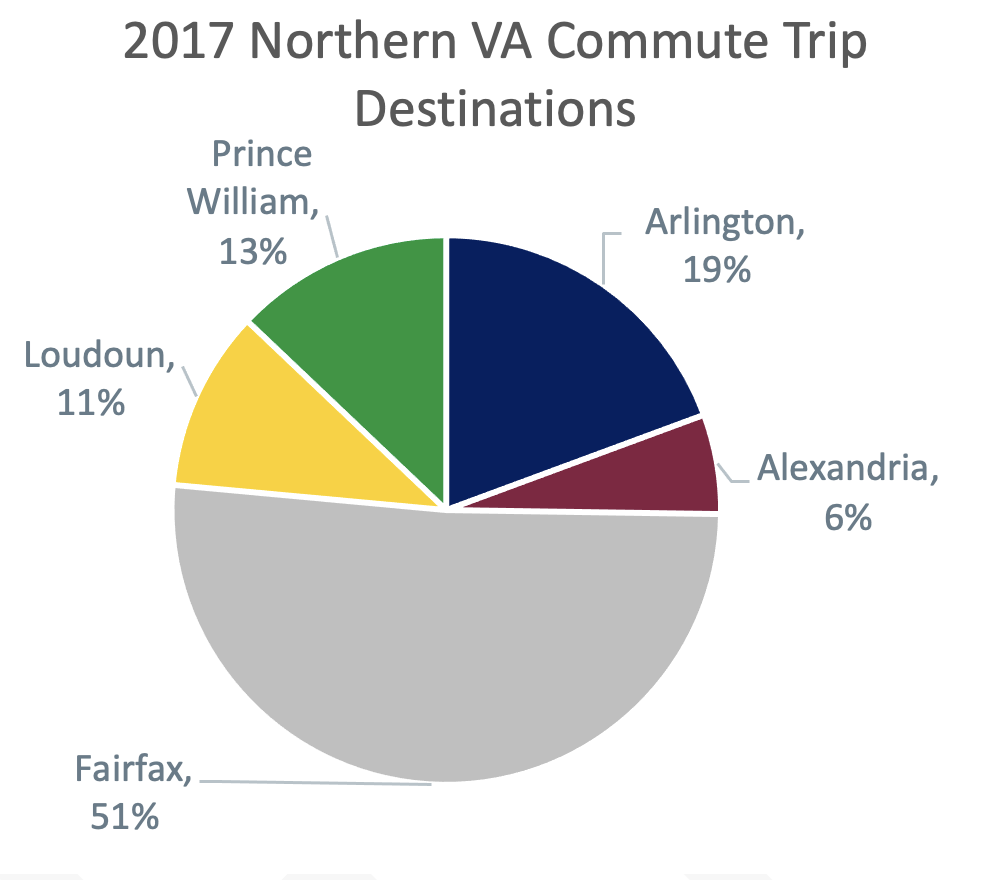
Below, the pie charts show the 2017 commute patterns for trips that end in Northern Virginia. Almost all commuting trips (78 percent) that ended in Northern Virginia also originated in Northern Virginia. About half of the trips ended in Fairfax, followed by 19 percent in Arlington. Of the trips with a destination in Fairfax County, a full quarter are headed to the Tysons area, representing 13% of total commute trips to Northern Virginia.


Note: Fairfax includes City of Fairfax and Falls Church. Prince William includes Manassas and Manassas Park
Growth in Commuting Trips
Key observations from travel forecasts of work trips in the region:
- Total commuting to and from Northern Virginia will increase by 470,000 daily trips, or 31 percent, from 2017 to 2045, forecasted to total 1.8 million person trips.
- In 2017, 73 percent of commute trips starting in Northern Virginia remain in Northern Virginia. This increases to 76 percent by 2045, reflecting the growth in Northern Virginia jobs outpacing growth in DC and Maryland jobs .
- Daily commute trips staying within Northern Virginia increase 35 percent from 2017 to 2045, while daily commute trips leaving the region only increase 14 percent.
- Northern Virginia continues to attract more commute trips from neighboring jurisdictions in Virginia and Maryland, beyond the District. From 2017 to 2045, total commute trips from jurisdictions outside Northern Virginia and D.C. increase by more than 103,000 trips daily (a 43 percent increase).
Non-Commute Trip Patterns
In 2017 and forecasted for 2045, non-commute trips, such as trips for shopping, school, health and other services, and trips for social or recreational activities, represent approximately 82 percent of daily person trips in Northern Virginia. For non-commute trips that start in Northern Virginia, in both 2017 and forecasted for 2045, 94 percent of the trips remain in Northern Virginia. Non-commute trips tend to be highly local in nature and are therefore much more likely to stay within Northern Virginia than commute trips. The average non-commute trip length is 6.7 miles for the region in both 2017 and forecasted for 2045, with average travel time increasing slightly from 13 minutes to 15 minutes.
The upcoming posts in this blog series will continue to explore the needs and opportunities for travel in the Northern Virginia region through 2045. The next edition will explore the public’s feedback to a recent tracking survey that examined transportation attitudes and preferences.
