This edition of the TransAction At-a-Glance blog series continues to identify the needs in Northern Virginia’s multimodal transportation system. One of the chief goals of the TransAction update is accessibility, or how well residents of Northern Virginia can reach their destinations, including jobs, education, and health care via multiple transportation modes today and through 2045. The needs assessment looked at the performance of the transportation system, detailing existing and future accessibility of the transportation system. This blog highlights two aspects of accessibility–access to jobs and access to high-quality transit.
Access to Jobs
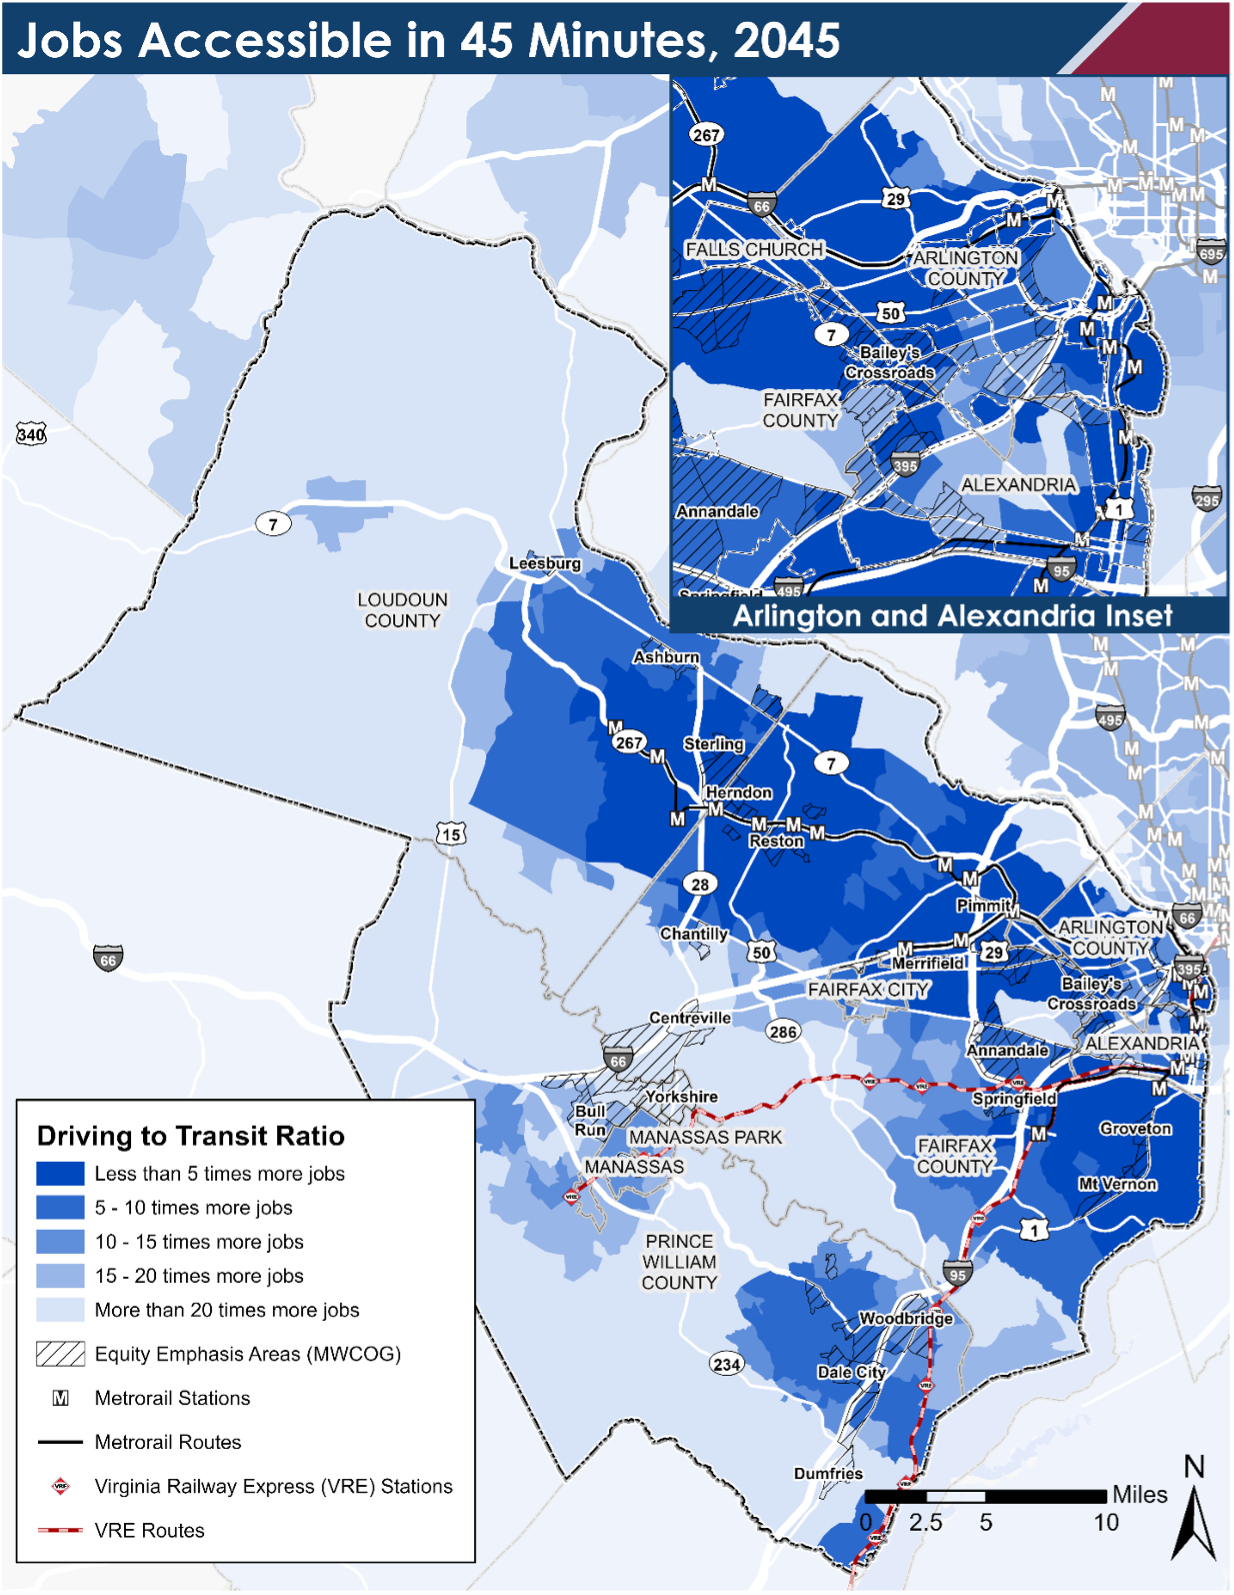
Access to jobs is significantly more limited in Northern Virginia by transit than by driving. Forecasts of the 2045 Constrained Long Range Plan (CLRP) transportation network developed with the Transportation Planning Board (TPB) travel model were used to estimate jobs accessible by driving or transit within 45 minutes. Based on a population-weighted average, residents of Northern Virginia have access to approximately four times more jobs by car than by transit.
In the map below, darker blue areas are those where transit begins to compete with driving as a way to access jobs. The lighter shaded areas are those where driving provides substantially more access to jobs. However, even areas within the region with the highest job access by transit still had more than two times more jobs accessible by driving within 45 minutes than by transit. Transit accessibility to jobs varies from more than a million jobs reachable for residents in highly connected locations such as Arlington, to zero jobs accessible by transit for areas without any transit service. While major investments, such as the extension of the Silver Line, will help address these gaps, significant disparities will still remain even in 2045.

Equity Emphasis Areas (EEAs) have been identified by the Metropolitan Washington Council of Governments (MWCOG) as part of Visualize 2045 to identify communities that have significant low income and/or minority populations. Compared to job accessibility for all communities in Northern Virginia, residents of EEAs are estimated to have access to 12% more jobs by both transit and driving than residents of non-EEA neighborhoods. While EEAs do not have less access to jobs than non-EEAs, EEA residents will still only be able to reach 24% of the jobs by transit that are accessible by driving. This is important because many residents in EEAs are more dependent on transit to access jobs and other opportunities.
Access to High-Quality Transit
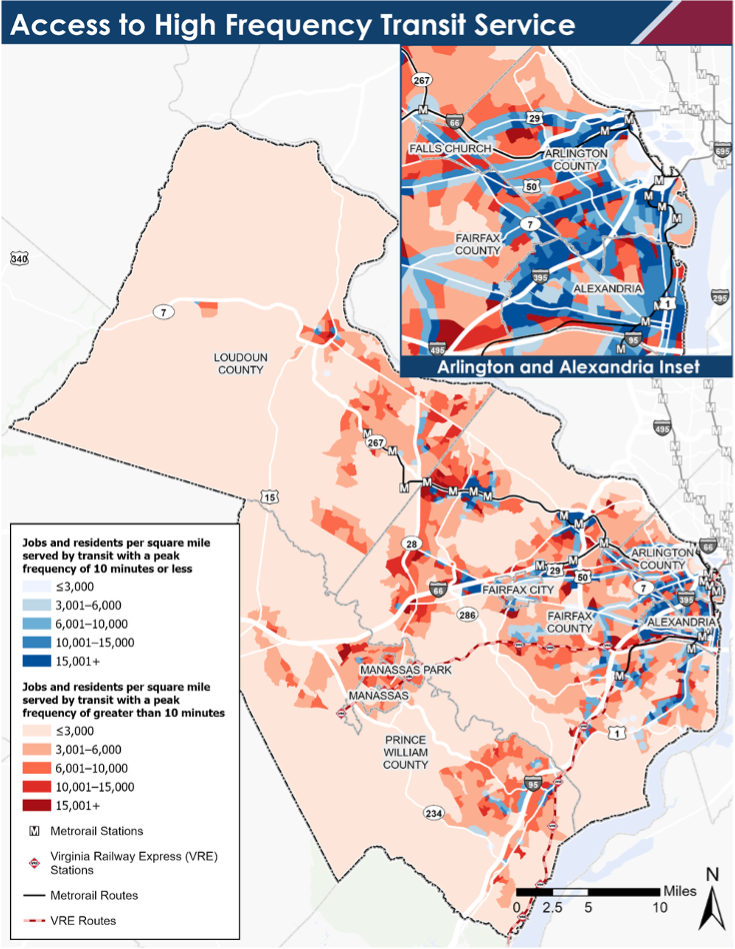
In evaluating access to transit, the TransAction needs assessment identified areas within ¼ mile of fixed-route public transit and the prevalence of either all-day or frequent transit. All-day service includes transit operating at least 18 hours a day and frequent service includes transit operating at 10-minute or better headways during the AM Peak.
While much of the region has access to some transit service, most routes operate infrequently or do not run beyond the peak periods. The map shows blue areas where the service frequency is less than 10 minutes. Large areas of the region are served by less frequent service (depicted in orange). Additionally, only 45% and 44% of jobs are within a quarter mile of frequent and all-day transit service, respectively.

When combining these factors, only 27% of the population lives within a ¼ mile of frequent or all-day transit. Communities inside the Beltway have the best access to all-day and frequent service, with only minor gaps in coverage. Outside the Beltway, where the population density is lower compared to inner suburbs, there are more substantial gaps in access to frequent and all-day service. However, as shown in the map, there are highly populated areas in Loudoun and Prince William counties, along the I-95, I-66, and Dulles corridors that have higher densities, but lack access to high-frequency service.
Opportunities to Address Accessibility Needs
Based on accessibility analysis conducted for the needs assessment, TransAction identified the following opportunities to increase access to jobs, employees, markets, and destinations for all communities:
- Jobs and Opportunities: Address areas with most disparate transit versus auto access to jobs through transit service expansion or other strategies to provide more travel options for these communities.
- Equity: Explore opportunities for new or more frequent or flexible transit services within these communities.
- Critical Services: Explore opportunities for new or more frequent or flexible daily and off-peak transit services connecting nearby communities to these key destinations.
- First Mile and Last Mile:Explore opportunities for new or more frequent or flexible daily transit services in these areas with safe and accessible pedestrian network and accommodations to access transit service.
- Bicycle Infrastructure:Equitably prioritize planned trail corridors and other bicycle facilities that would address areas with high bicycle level of traffic stress and contribute to a safe and continuous network.
